

It’s (almost) the most wonderful time of the year (if you like the cold and/or snow)!
Before going in-depth, please keep in mind that meteorology is not an exact science, and climate-based meteorological forecasts are more complex. They are not produced in a similar fashion when compared to day-to-day forecasts.
I have been researching various factors that impact winter weather across the Tri-State Area and the U.S., from previous analogs to sea surface temperatures and teleconnections.
Before I get into specifics on temperatures, precipitation and snowfall; let’s discuss the major factors that went into creating my outlook.
SEA SURFACE TEMPERATURES AND THE OCEANS
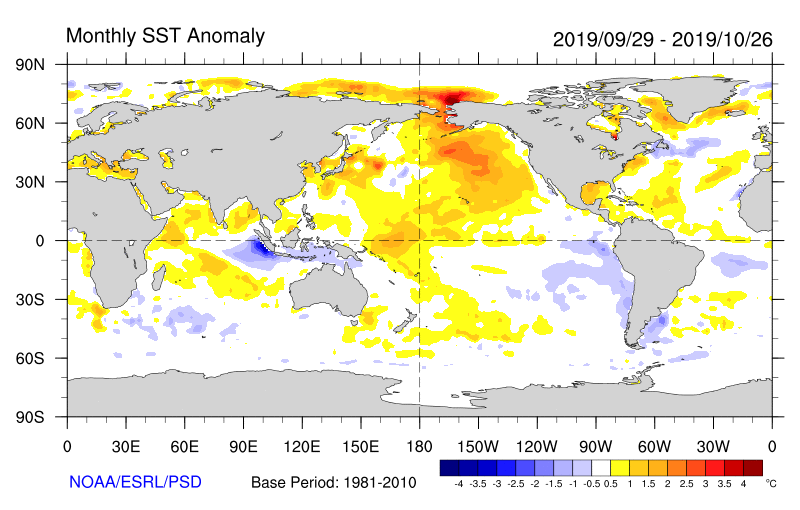
A saying that I’ve learned and treasured is that the oceans run the weather. This applies for winter, too.
Winter 2018-2019’s forecasts were a bust! As already noted, the complexities and large number of factors that go into forecasting a long-range outlook make for a difficult forecast. And, the Pacific Ocean is a major driver for the weather in the United States. The split jet and zonal flow (weaker and faster storms) seen last winter across the Pacific Ocean were major factors overlooked when creating last year’s winter outlook, ultimately affecting the winter the U.S. saw.
Also, water temperatures along the equatorial Pacific dictate the weather that forms at higher latitudes. This winter is shaping-up to feature an ENSO-neutral profile. (ENSO stands for El Nino Southern Oscillation)
WHAT ARE THE DIFFERENCES BETWEEN EL NIÑO, LA NIÑA & NEUTRAL?
El Niño - warmer-than-normal sea surface temperatures across the Equatorial Eastern Pacific
La Niña - cooler-than-normal sea surface temperatures across the Equatorial Eastern Pacific
(ENSO) Neutral - basically neither El Niño or La Niña! Sea surface temperature anomalies across the Equatorial Eastern Pacific average out to near-zero.
Last winter featured a specific kind of El Niño, Niño 3.4, where the warmest waters are closer to the Central Pacific. It is also commonly called a ‘Modoki El Niño.’


WATERS ACROSS THE PACIFIC
Other ocean spots crucial to my outlook are located on the opposite side of the world! The Indian Ocean (Indian Ocean Dipole - IOD) and Australian waters (Southern Oscillation Index - SOI) have downstream impacts to weather across the Pacific.

NORTH ATLANTIC SEA SURFACE TEMPERATURES

The immediate Atlantic Ocean is anomalously warm for this time of year, by as much as 5°C near the Gulf Stream. Any and all coastal systems that tap into that warm water will strengthen further and faster. This will enhance a process called bombogenesis, when a low pressure system strengthens 24 millibars in 24 hours.
TELECONNECTION INDICES
These indices help give forecasters a sense of where atmospheric ridging and troughing will tend to occur. (Ridging usually signifies higher pressures and above-average temps; troughing usually signifies lower pressures and below-normal temps)
One of the most-talked about indices is the North Atlantic Oscillation (NAO). This basically denotes whether high pressure or low pressure dominates in the North Atlantic, near Greenland.

A negative NAO, also known as the Greenland Block, means high pressure dominates in the far-northern Atlantic, creating ‘downstream blocking.’ This basically causes a roadblock for our weather in the Northeast U.S., slowing down any potential storms. It also promotes troughiness across the Eastern U.S.. A positive NAO on the other hand, means low pressure dominates near Greenland, and creates ridging across the Eastern U.S..
Another important teleconnections index is the ‘Pacific North America Index’ (PNA). This is another place where my winter outlook did not verify last winter. The PNA kept reverting to its negative phase, allowing the Southeast Ridge to develop off the Southeast U.S. coast. This also kept the trough (colder weather) out west.

Most indications, however, suggest the PNA transitioning to its positive phase, suppressing the Southeast Ridge, and allowing more troughiness to set up over the Eastern U.S..

This is also supported by the current PDO, or Pacific Decadal Oscillation. The 'warm blob' south of the Aleutian Islands, seen by the current SST anomalies, should help promote the positive phase of the PNA.

STORM TYPES

MILLER TYPE-A This type of coastal storm originates in the very warm Gulf of Mexico waters, when a low pressure system forms, and that energy begins moving northward along the East coast.
There is typically no primary low from the west that transfers energy; Miller Type-A storms are ‘solo’ acts in terms of low pressure. A high pressure system to the north (from the Polar Jet Stream) typically provides a cold (arctic) air source.

MILLER TYPE-B This type of coastal storm forms when energy from a primary low is transferred to the Atlantic coast. The new coastal low then strengthens as it moves northward along the Mid-Atlantic and/or Northeast coastlines.
This type of coastal storm typically involves both the Subtropical and Polar jet streams, where ‘phasing’ sometimes occurs. This allows the coastal low to further-strengthen. A 'split jet' and/or zonal flow inhibit Miller Type-B storms.
Note: both of these graphics note a ‘textbook’ definition of Miller Type-A and Type-B storms; essentially a generic model. No two storms are ever the same! Many factors, from the exact track of the coastal low, to the strength/positioning of the arctic high, and more, dictate the intensity and type of precipitation different locales see, especially along the I-95 corridor.
Okay, now to my actual winter outlook:
TEMPERATURES

This winter will likely feature plenty of cold and warm spells, ultimately ending slightly-above average for the season in the Tri-State Area.
Climatologically, the Northeast has seen some variation of above average temps for most of the last decade, despite different variables suggesting below average temperatures. There does not seem to be overwhelming evidence though for below average temperatures, and the core of the cold looks to stay to our west.
We’ll likely be about 1°F (or a tad less) above average.
The core of the cold will likely be between early/mid January and mid February, and I do not see another stretched-out winter, as March and April look to bounce straight into Spring.
PRECIPITATION

The analogs I’ve relied-on more scream several areas of below and above average precipitation.
Unfortunately for the wildfires in California, precipitation looks to be hard to come by for the next several months. Same applies for the West Coast. Other analogs also point to dry weather for parts of Texas and Oklahoma. They also show hints of above average precipitation for the Tennessee and Ohio River Valleys, extending into the Mid Atlantic.
SNOWFALL

With more Miller Type-B storm tracks, and better storm timing with cold shots, most of the Northeast seems in-line for slightly-above normal snowfall. The interior Northeast, and the mountain ranges, will likely benefit well (again) this winter. With enhanced Lake Effect Snow opportunities, they look to be above normal as well. With below average temperatures and an active polar jet, parts of the Northern Plains may also see higher snowfall.
Parts of the Rockies and Sierra Nevada may not do so well with snowfall this winter based on the likely pattern setting up. Same for the Pacific Northwest, where temperatures will not be very cold, and precipitation will be below average.
Snowfall is oftentimes the trickiest aspect of the long-range winter forecast, let alone the lead-up to every individual coastal storm! I have been taught to always stay on the conservative side when predicting above-average seasonal snowfall. Think of it as a winter version of the bidding process on the Price Is Right. It only takes one or two major coastal storms to throw the snowfall total number right out the window!
With that in mind, I am predicting around 125% of the normal in NYC. Given that the average annual snowfall in the 1981-2010 climatological data is 25.1” at Central Park, 125% would be 31.4”. My forecast snowfall for NYC is 28-36”, but one major coastal storm with the perfect cold and snowy ingredients could bump this number higher (or lower if the ingredients don’t mix).
Areas in NW New Jersey, Middle/Upper Hudson Valley, Poconos, and Catskills, look to be closer to 150% of the normal, likely meaning great news for skiers and ski resorts.
I hope you found my winter outlook both informative and interesting, and stay with me for the latest updates throughout the winter! You can always find me on Twitter and Facebook, @AWxNYC.
P.S. a HUGE shoutout to News 12's Mike Rizzo and SJNtv's Nick Pittman for helping me craft this article. They are AMAZING at what they do and are my role models. You can check out Mike, @Meteor_Mike and Nick, @NorEasterNick.
P.S.S. don't forget to turn your clocks back one hour Saturday Night!